
Business intelligence
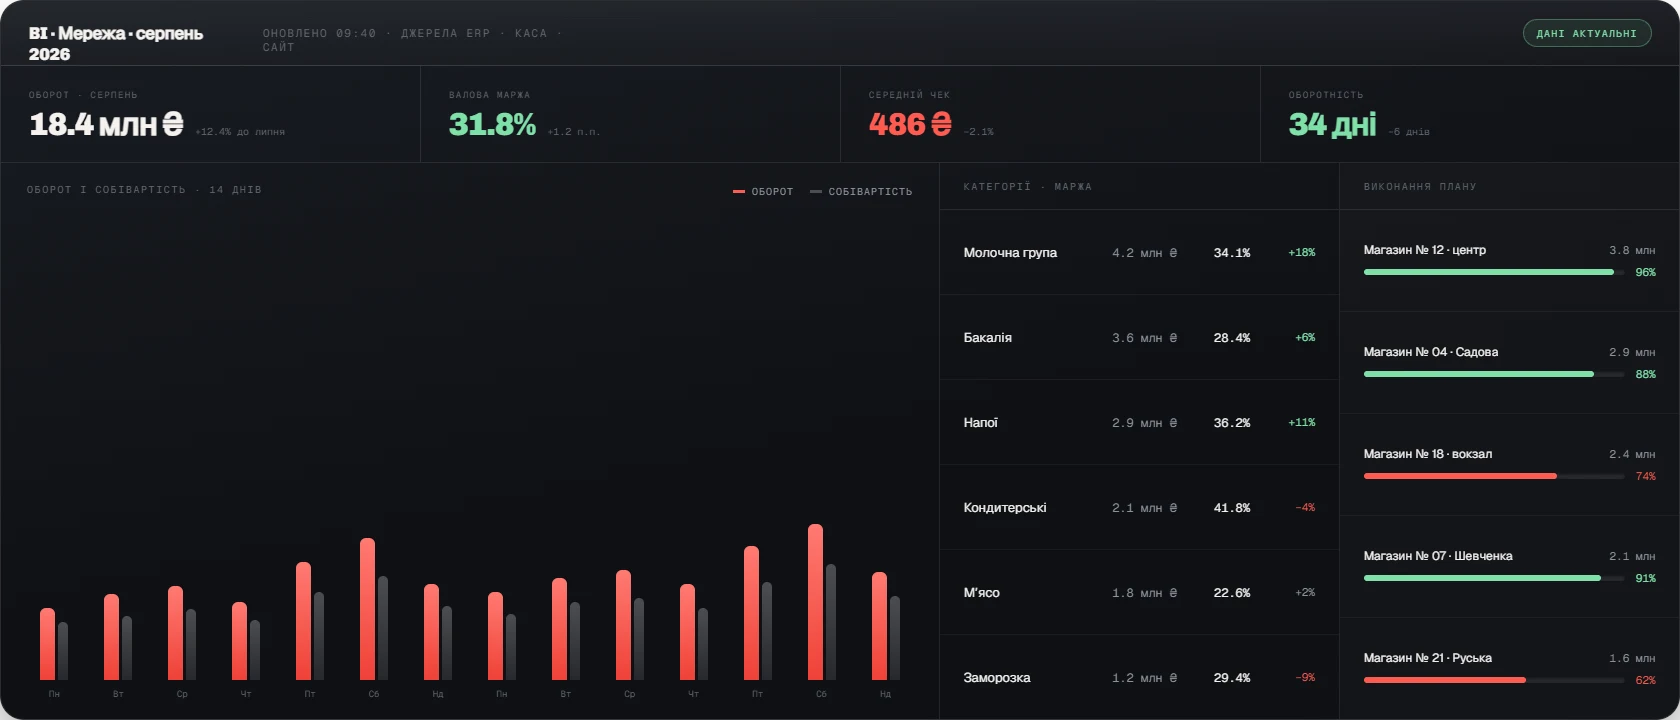
BI is a system that collects data from every accounting source into one warehouse and shows it as dashboards built for specific management decisions. Its job is not pretty charts but making sure a manager gets the answer to their question in ten seconds rather than two days after asking accounting.
What it is
Business Intelligence has three parts. The first is a data warehouse, into which data from the ERP, CRM, till, website and external services is loaded on a schedule. The second is a model in which that data is reconciled: one product directory, one calendar, one set of rules for calculating margin. The third is the dashboards, each answering the question of a specific role: the owner needs margin and turnover, the sales director needs conversion and targets, the warehouse manager needs stock and dead inventory.
The main difference between BI and reports inside an accounting system is speed and depth. An accounting system answers “how much did we sell”; BI answers “why did we sell exactly that much” — broken down by product groups, locations, managers, channels and periods, with the ability to drill from a headline number all the way to a specific document. And it refreshes automatically, with no manual exports into spreadsheets.

Why you need it
BI is needed when decisions are made on gut feel, because the numbers take too long to prepare.
- Reports are made by hand
Several people compile spreadsheets every month, and each of them compiles them differently.
- The numbers do not agree
Two departments bring different figures for the same thing, and meetings start with a reconciliation.
- Margin is unknown
The company knows its turnover but not which items bring profit once all the costs are in.
- The reaction comes too late
A problem shows up in last month’s report, when nothing can be done about it.
What the system owns
BI owns the accuracy, consistency and availability of management data.
- Data warehouse
Regular loading from every system, a history of changes, a single point of truth.
- A reconciled model
Shared directories and shared rules for calculating metrics across every report.
- Dashboards by role
Separate panels for the owner, sales, warehouse, finance and marketing.
- Sales and margin
Breakdowns by product, location, manager and channel, compared against other periods.
- Stock and turnover
Shortages, surplus, dead stock, ABC analysis, frozen capital.
- Forecast and plan versus fact
Targets, variances, automatic reports emailed on a schedule.
What implementation delivers
BI removes the manual preparation of reporting and the arguments about figures. The manager opens a dashboard and sees the current state of the business in the breakdowns they need, rather than a retelling in slide form. We build BI on the data from your systems — from the ERP and the till to the website — and set up refreshes so the numbers are fresh at the moment of the meeting.